Formulas in Excel
There are lots of good tip sheets and reminders of how to use formulas in Excel. This page will walk you through an example, but consult these excellent resources if you get stuck:
-
If you’re brand new to spreadsheets, or feel uncomfortable, start with Mary Jo Webster’s “Beginner Excel” tutorial.
-
Jaimi Dowdell’s quick list of Excel formulas. It’s written for Windows, but nothing is different on a Mac in this list.
The math review is going to use the City of Phoenix’s budgeted spending for the 2018 fiscal year, compared with previous years. (Source: https://www.phoenix.gov/budget/annualbudget)
- Before you start
- Formulas in spreadsheets
- Common spreadsheet arithmetic
- While we’re at it: two kinds of averages
- The final spreadsheet
- FAQs
Before you start
Files needed for this tutorial
- An example data diary for the processing that went into this spreadsheet for this tutorial.
- The Excel spreadsheet for this tutorial.
Get into good habits
You should get into the habit of creating unique identifiers, checking your corners and looking for documentation before you ever start working with a spreadsheet. Look at the handouts on the data diary and on an Excel refresher if you don’t remember what that means.
Formulas in spreadsheets
Whether you use Excel or Google sheets, remember that every formula begins with the equals sign (=). Rather than the values you want to work with in the formula, you’ll use references to other cells in the sheet.
The easiest formulas are simple arithmetic: adding, subtracting, multiplying and dividing two or more cells. You’ll just use simple operators to do this:
| operator | symbol | example |
|---|---|---|
| addition | + | =A2+B2 |
| subtraction | - | =A2-B2 |
| multiplication | * | =A2*B2 |
| division | / | =A2/B2 |
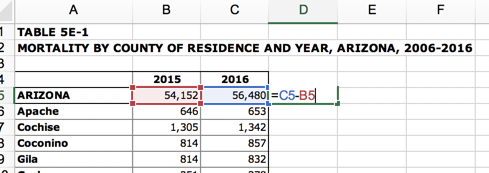
Here’s what a spreadsheet looks like while editing some simple arithmetic:
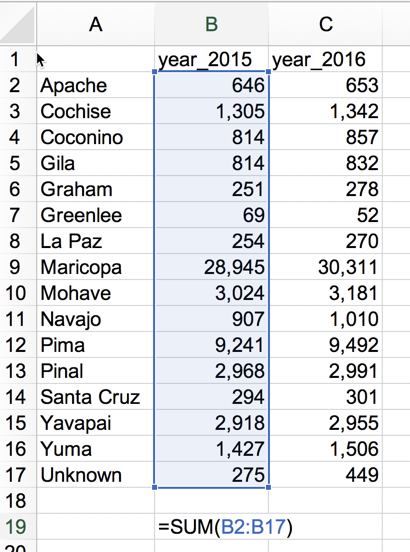
The other kind of formula is a function. You’ll learn more about that later, but it’s a set of commands lumped together as a convenience. Some of the most common are =SUM(start:finish), =AVERAGE(start:finish) and =MEDIAN(start:finish), where “start” means the first cell you want to include, and finish means the last cell.
Here’s an eample of adding up all of the rows in a list by county:
Common spreadsheet arithmetic
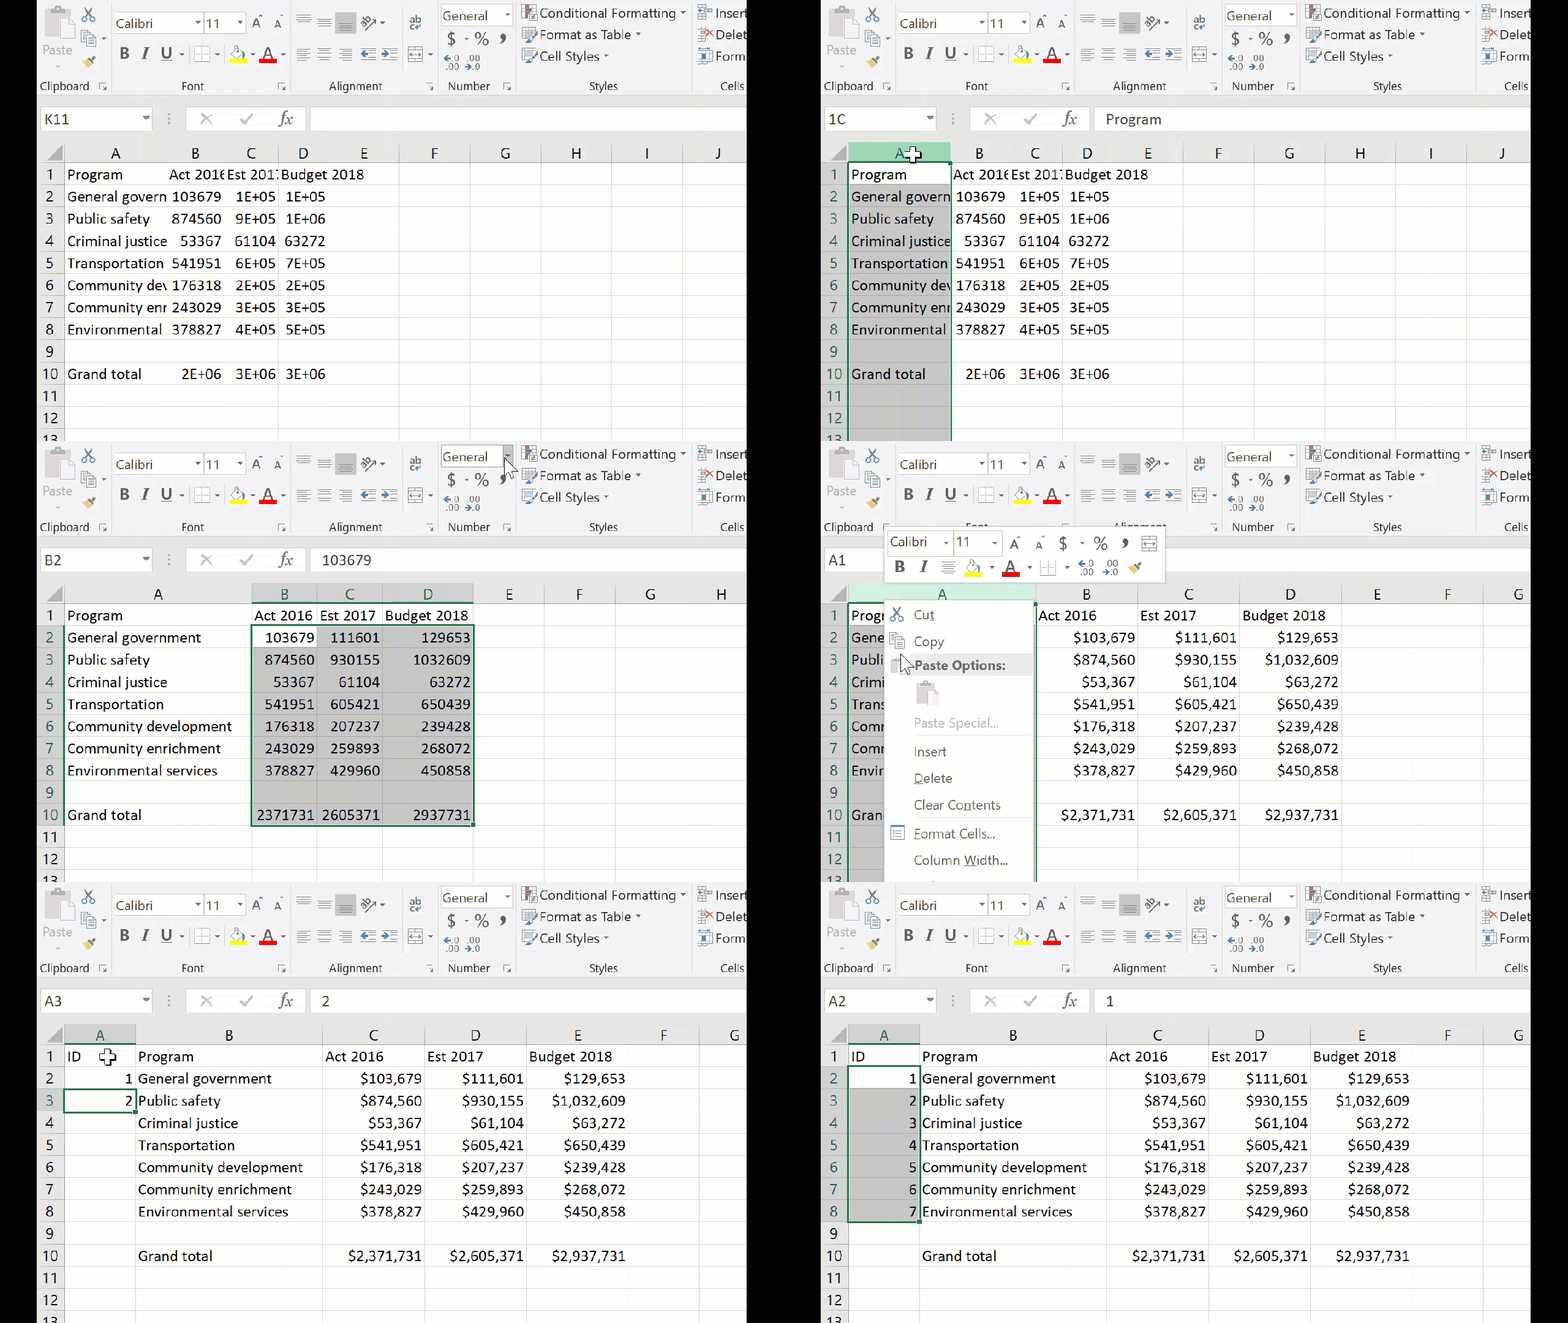
The budget document shows three years’ of data: The actual spending in the fiscal year that ended in 2016; the spending that was estimated for the end of fiscal year 2017; and the proposed spending for fiscal year 2018. The first page of the document shows these amounts for broad spending categories.
You may want to widen the columns and format the numbers before you start:
Check the government’s math with SUM
Our first job is to make sure the government has provided us data that adds up. To do that, we’ll SUM all of the departments’ spending.
To add up the numbers from 2016, enter the following formula in cell C11, just below the number provided by the government:
  =SUM(C2:C8)
  and hit the enter key
Copy that formula to the right. Notice how the formula changes the addresses that it is using as you move to the right – it’s adjusted them to refer to the current column.
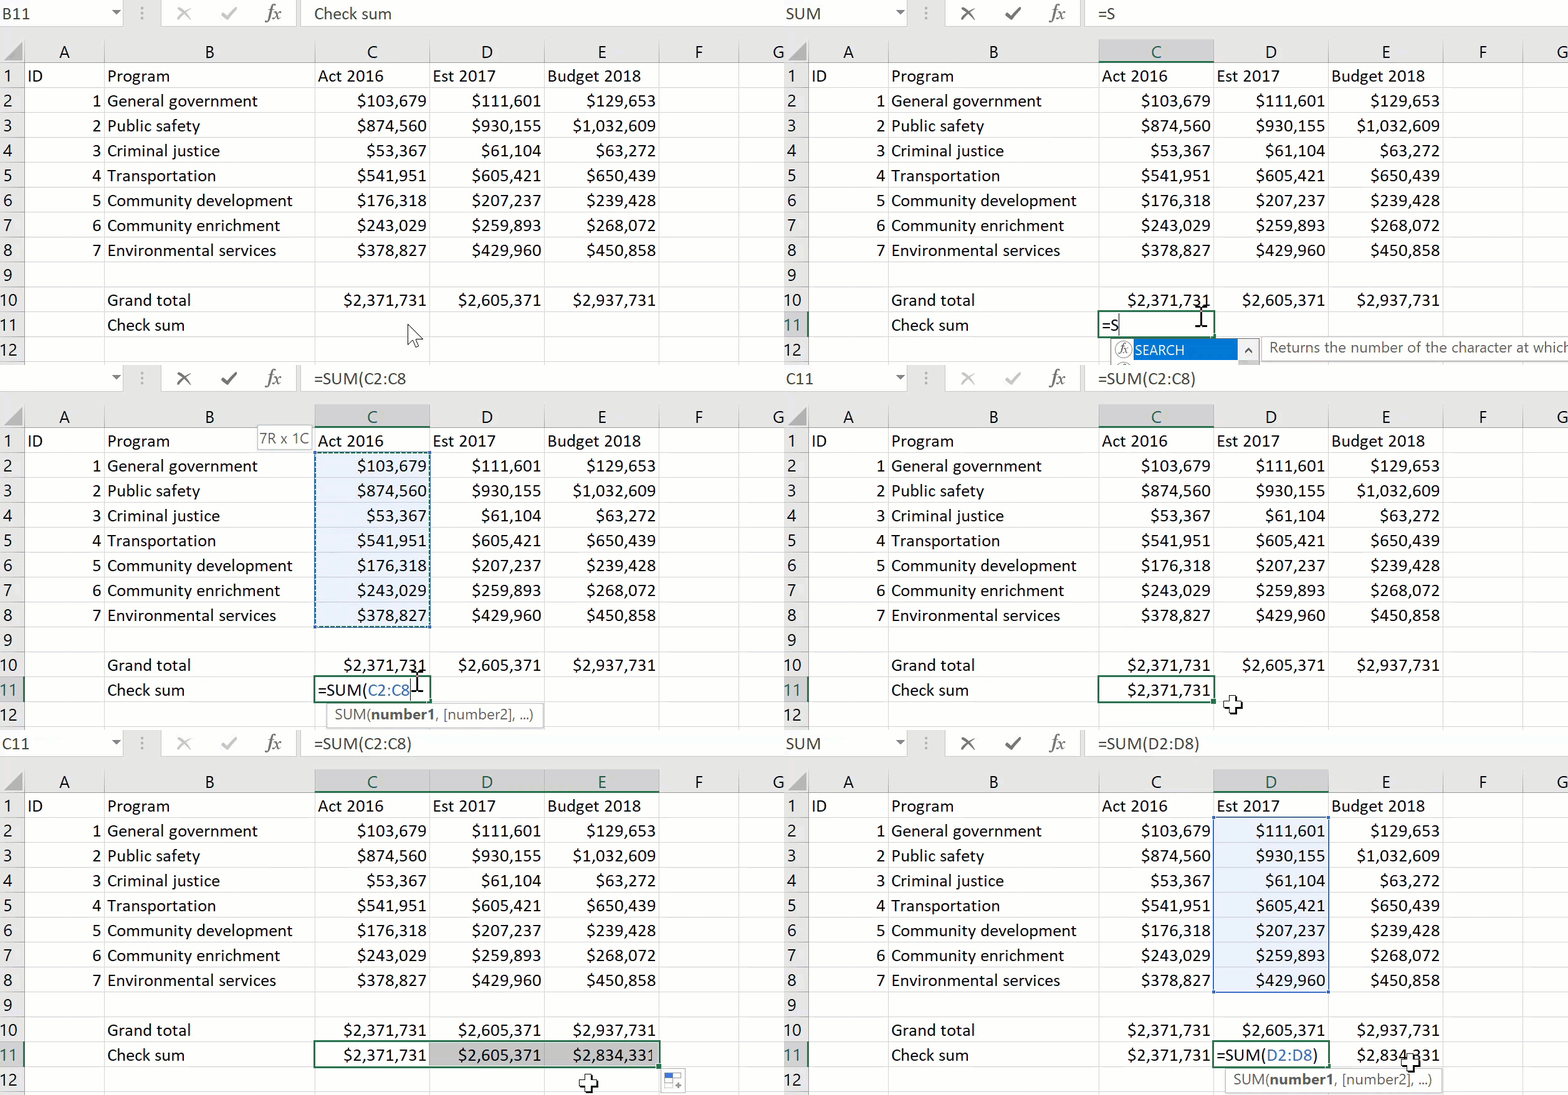
What’s wrong? The numbers for the budget 2018 don’t add up. (Hint: look at the page called “notes” for an explanation.)
Change in spending
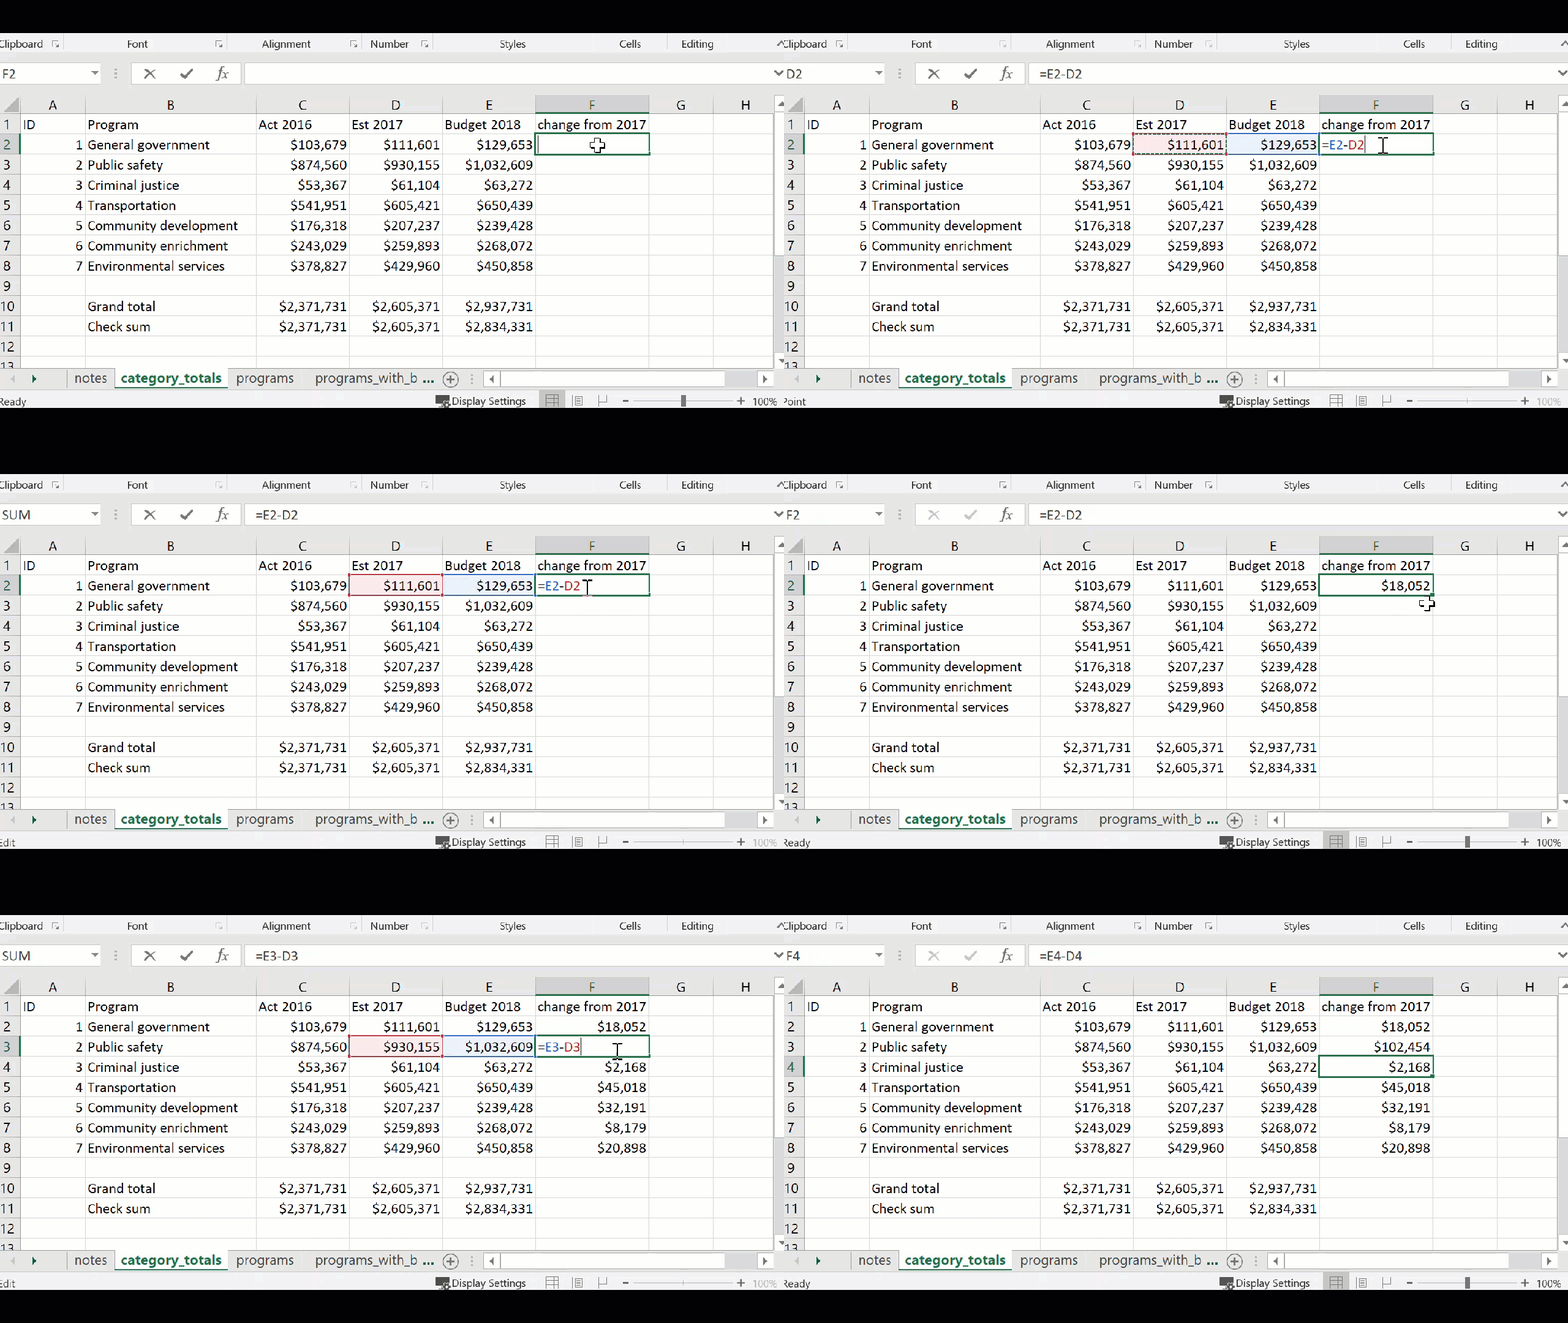
The increase or decrease in projected spending from 2017 to 2018 is just the difference between the two values, beginning in cell F3
new-old, or =E2-D2
When you copy it down, note how the references to each row also adjusted. In line 3, it’s E3-D3, and so on. Excel and other spreadsheets assume that, most of the time, you want these kinds of adjustments to be made.
Percent change
We can’t tell the rate of growth for each department until we calculate the percent change from one year to another. Now that we already have the change, the percent change is easy. The formula is:
  ( new - old ) / old

  .. or just scream "NOO"
We’ve already calculated the new-old part, so now all that’s required is to divide by the old value. In grade school, you also had to move the decimal place over two spots, since the concept of percent change is “out of 100”. Excel formats will do that for you.
Remember, it’s always (new-old)/old , NOT the big one minus the little one. Doing it correctly, the answer could be negative, meaning the value fell.
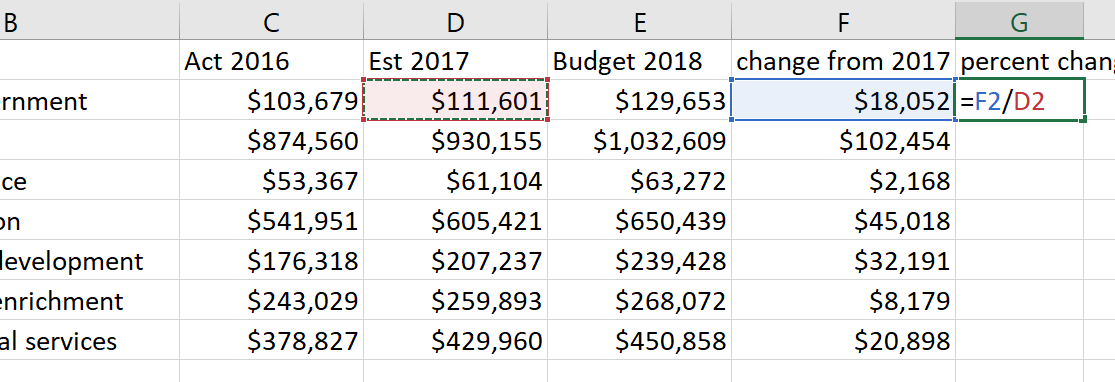
When you’re done, you can format the answer as a percentage to get it into whole numbers.
Until you get used to it, there’s no harm in doing these calculations step by step. Excel won’t complain if you have extra columns. You can always hide them.
It’s also worth comparing the picture you get by looking at raw numbers vs. percentages. In our case, the budget for public safety is expected to rise by a whopping $102 million, but it’s a smaller percentage increase than other, smaller departments.
Parts of a whole: percent of total
We’d also like to know what portion of the total spending is eaten up by each department. To do that, we need the percent of total.
In our case, let’s use the total that the government gave us. In practice, you’d have to decide what to do if your figures didn’t match those provided by officials. You can’t assume that the total is wrong – you could be missing a category, or there could be a mistake in one of the line items.
The formula for percent of total is:
category / total
Again, Excel will multiply by 100, or move the decimal place over for you once you format.
But you have a problem: You either have to type in each row, or you get something like this if you try to copy:
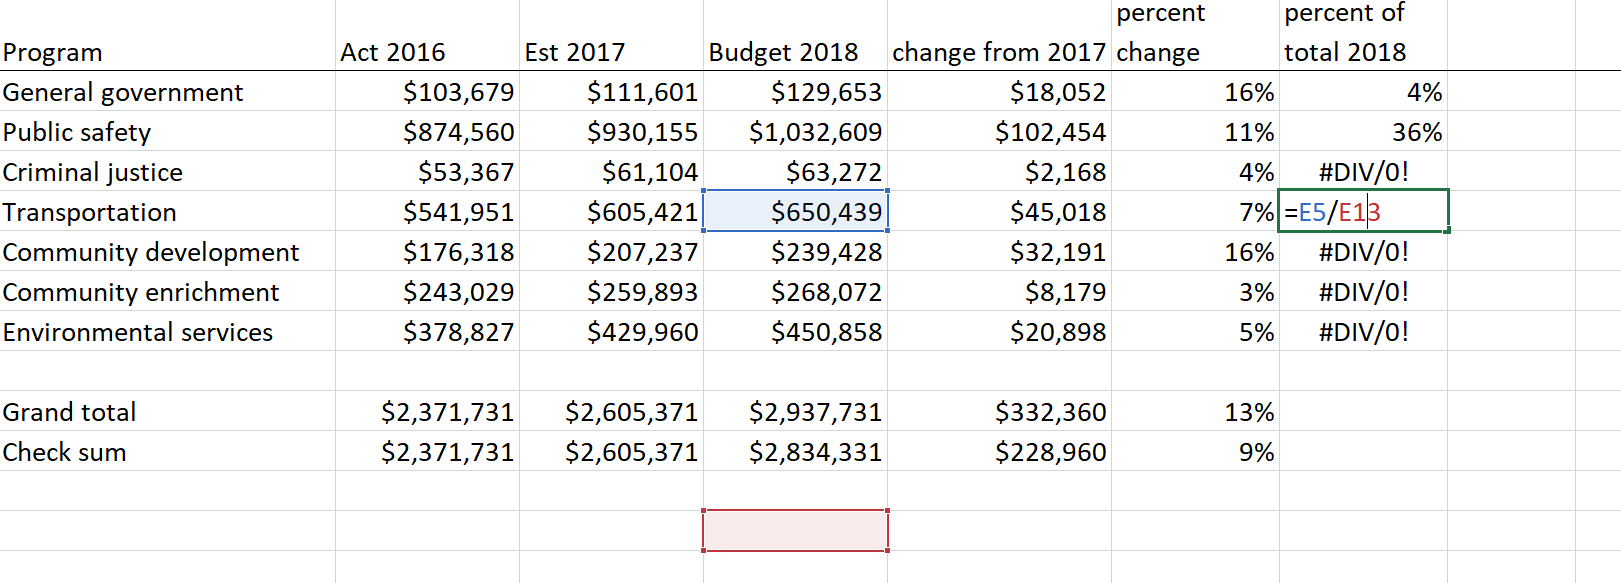
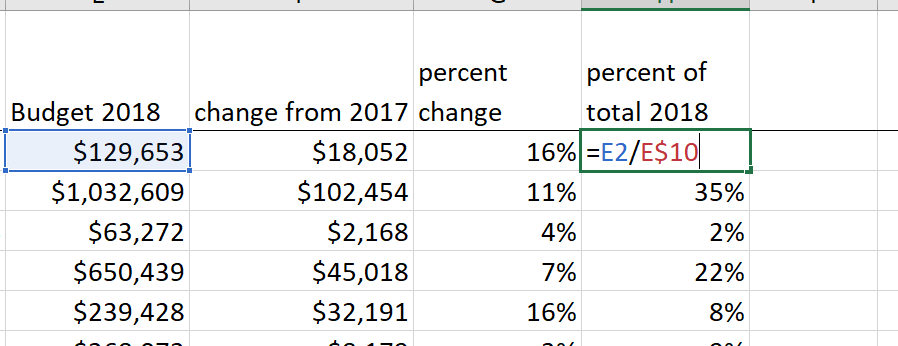
Excel has done its magic, adjusting the location of both the numerator and the denominator when you copied. You don’t have to type in each formula one by one, though. Instead, you’ll use anchors, known in spreadsheets as “absolute references”. Think of a dollar sign as an anchor or stickpin, holding down the location of part of your formula. If you put the stickpin before the letter in the formula, it holds the column in place. If you put it before the number, it holds the row in place. If you put it in both places, it holds the cell in place.
So our new formula for the percent of total is:
While we’re at it: two kinds of averages
Although it doesn’t make a lot of sense in this context, we’ll go ahead and calculate the average or mean size of each department, and then calculate the median size.
Simple average, or mean
A simple average, also known as the mean, is skewed toward very high or very low values. Its formula is
sum of pieces / # of pieces that were summed
But in Excel, all we need is the word AVERAGE:
=AVERAGE(C2:C9)
Median
There’s not really a good formula for the median. It’s the middle value of a list, once they’ve been put in sorted order. (If there is an even number of values, it’s the average of the two middle values.) This just treats a very high or very low value as just another number, and it doesn’t affect the summary very much.
For example, if we have five people with the following incomes:
    $8,000
   $10,000
   $12,000
   $15,000
  $500,000
The average, $109,000, will not be a good summary of the list. In fact, no one on the list makes anything like that. But the median, $12,000, reflects the middle of the pack. With America’s income inequality, this is common in anything measured in dollars like home values or incomes.
In Excel, you can get the median of a list of numbers by just using the formula, MEDIAN()
= MEDIAN(C2:C9)
The final spreadsheet
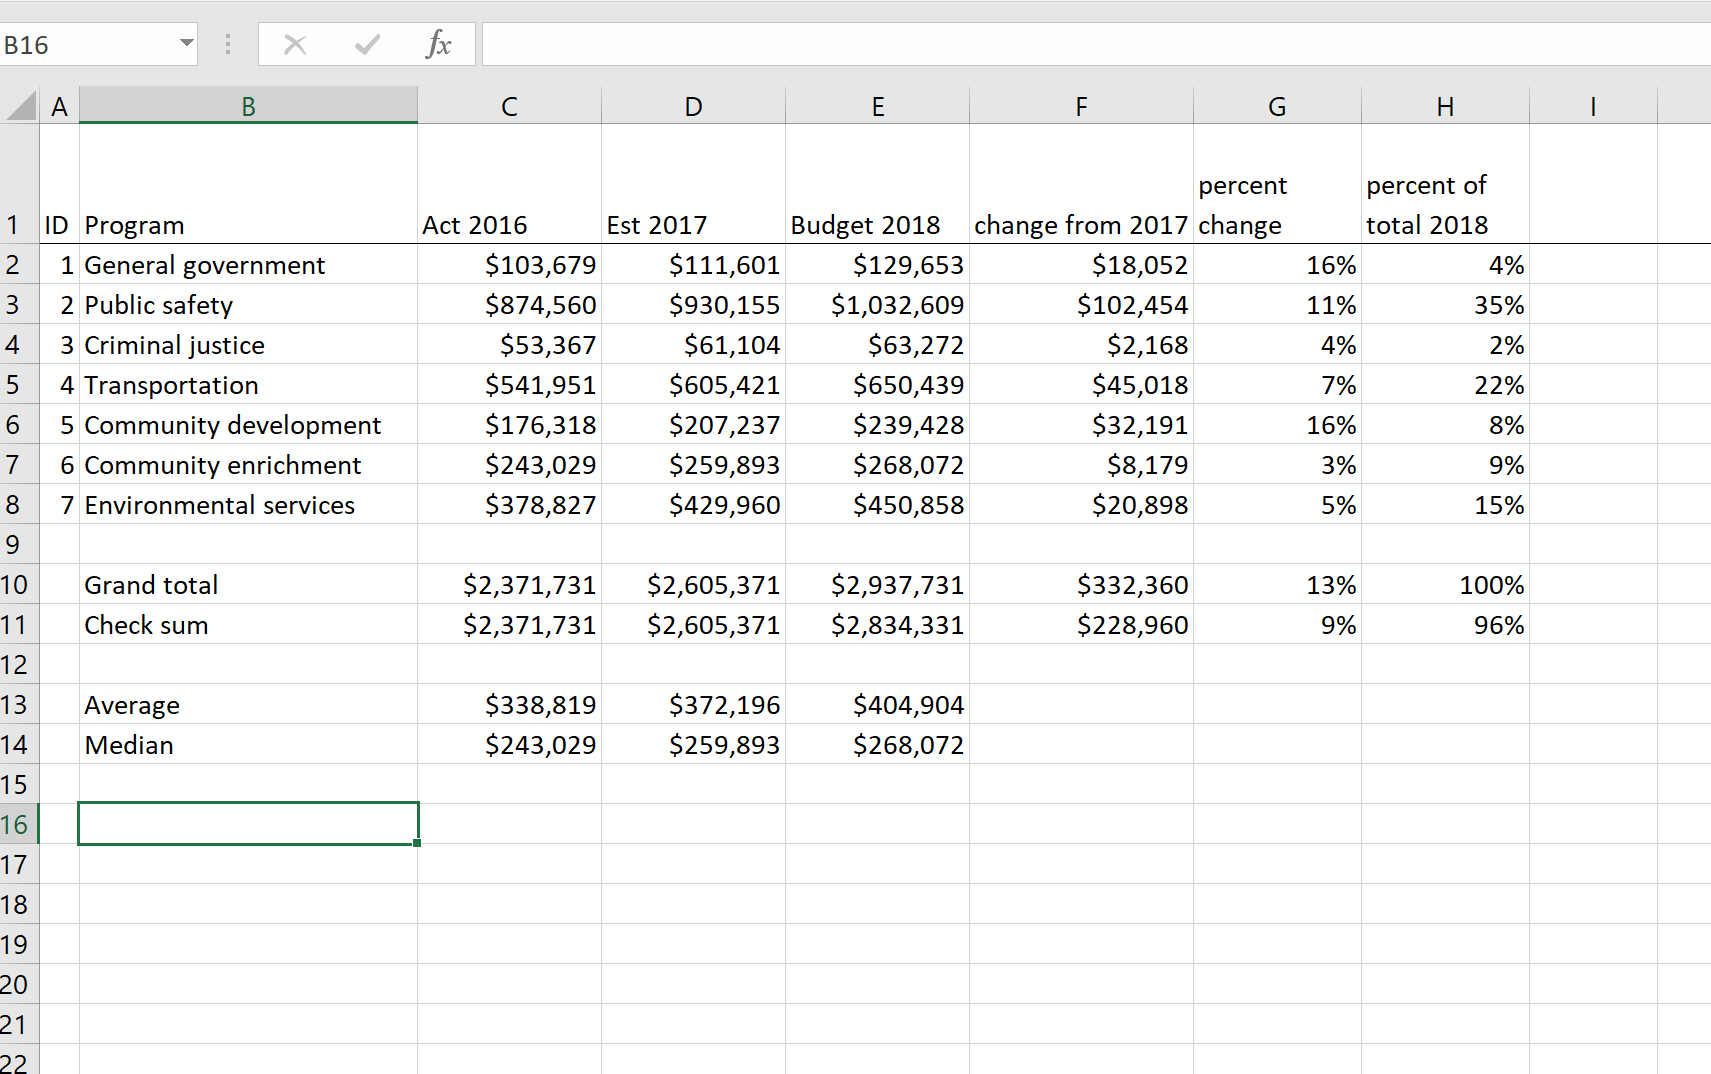
At this point, write out a few questions you might want to ask an official if you only have a few minutes. Now that you have some data that might point to news, you can use it to ask the official to confirm your analysis and explain the underlying reasons.
FAQs
Excel won’t let me copy my formula
Make sure your formula is locked in by either hitting “Enter” or “Escape”. This is a common problem if you’re in the habit of double-clicking instead of selecting a cell. There are a lot things you can’t do while Excel thinks you’re still entering information.
Should I use average or median?
It depends. Averages are easier to explain but can be misleading. Usually, if they’re very different, median will be a better representation of the typical person, city or department. Averages in these cases are more like totals.
My percents are small numbers with decimal points
Use the format as a % button to move the decimal point over two places and insert the percentage symbol.
Mac Users: There’s a little image of a cell covering up my spreadsheetß
I have no idea what this is, but it happens. Save your spreadsheet, close it and then re-open. It usually goes away.