Grouping from start to finish
This practice example goes through the kinds of work you have to do before you can even start filtering and grouping. It’s the “reporting” side of data reporting, even if it often means exploring data and reading.
This excercises uses a database of swimming pool inspections obtained by Courtland Jeffrey at ABC15 through a public records request to the Maricopa County Environmental Services department. This website reviews exactly which pools must be inspected.
Interviewing your database
Look for a guide on the agency website
Before you open the spreadsheet, review the material available on the county’s website. Read the information available on what the department does, and then click on the Swimming Pool Inspections link to the left.
The Weekly Report simply provides a list of the inspections conducted for a single week. Note that you can also search for a business name or address. This report should show you what each column in your spreadsheet means.
What do you have?
Now open your spreadsheet and start interviewing your data.
Use a filter to help you answer these questions:
- What makes this dataset “tidy”, or, alternatively, in what way is it “untidy”?
- Note what data type is in each of the columns – are they codes, categories, numbers or free text? Is the text standardized? Are there comments of the kind you would fill into a big box on a form?
- What is the date range of this dataset?
- What is the unit of analysis, or can’t you quite tell?
Note that this spreadsheet is formatted as a “data table”, which means you have the option of making formulas based on the column heading or based on their cell addresses.
How does what you have compare to what the agency shows?
If you look up a few of the addresses that you see in your spreadsheet, you can make sure you know what each column heading means by matching the values against the online version. You can also know a little more about what was NOT provided in this dataset under this request.
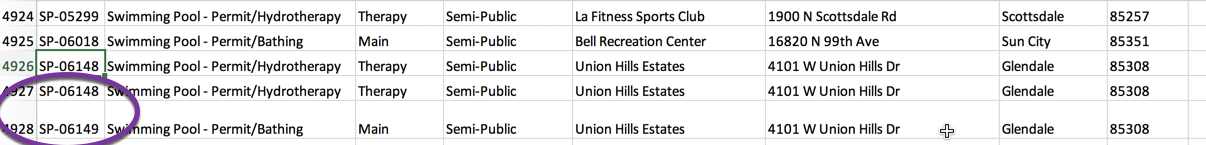
Note that it’s not always easy to find the right pool by looking up the name and address. For example, the Union Hills Estates “Main” pool doesn’t appear in the list of pools under that name or address. There are other pools, but none with the same Permit ID as the ones in our database:
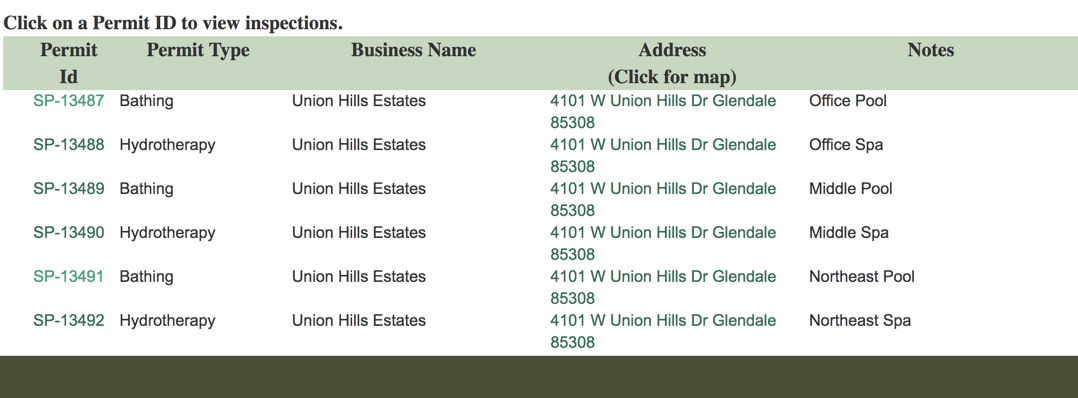
Let’s see if we can trick the Web app into giving us the proper pool to compare. In this case, try clicking on one of the existing pool numbers, then look at the URL in your browser:
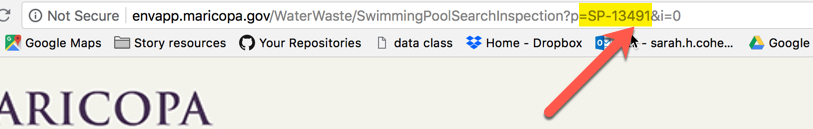
Change the url to one in your spreadsheet, then filter your spreadsheet for just that pool:
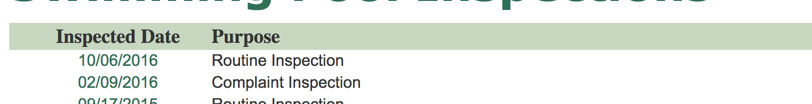
Two of the inspections that are in the date range of our dataset are shown on this list: 2/9/2016 and 10/6/2016. Take a closer look at them and compare what is in your spreadsheet to what is on the web.
If you click on the other inspection that you found in our database, you’ll see that, eight months later, a routine inspection showed that two of the violations are repeated, and that the county did nothing.
On your own, look up some other interesting items that you found on your database – try looking at different kinds of inspections, different outcomes, and different statuses to see how they are reflected on the web.
Jot down two or three story ideas that might emerge from an analysis of this, and two or three that would emerge if you had the data the way the county holds it – in a proper database rather than as a summary.
Start asking questions
Using your newfound deep understanding of swimming pool inspections, try answering these questions:
-
Which properties have had the most violations?
-
Find the most common violations.
-
Which violations lead to pool closures?
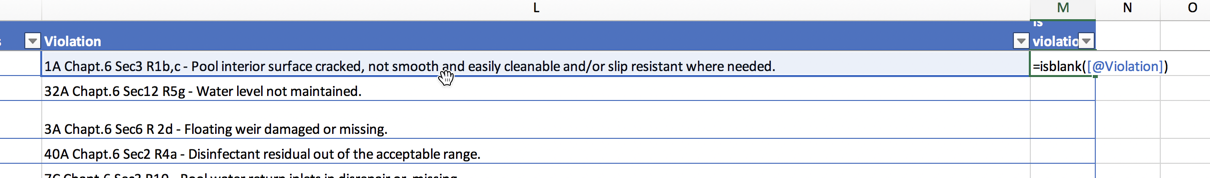
There are some things that will be hard without flagging some of the data – for example, if there was no violation, the address is still included. For that reason, you may want to add a column at the end that tests for whether there was a violation.
In this case, we can say that this is an INSPECTION record, if the violation is blank. Otherwise, it’s a VIOLATION record.
Going further
Create a unique identifier for each inspection, then group by that number to find the number of INSPECTIONS by type, rather than the number of VIOLATIONS or RECORDS. One way to do that is to use the numeric value of the dates to combine with the swimming pool ID. You can turn the date back into a number using the formula:
=TEXT([Inspection Date],"00000")
To put two text fields together, use the & symbol:
=[Permit ID]&TEXT([Inspection Date],"00000")
Now you can create a Pivot Table to show a row for every inspection