Pivot tables: How many? How much?
- Getting the basics first
- Files for this tutorial:
- More complicated pivot tables
- Crosstabs
- On your own
A pivot table is a powerful way to summarize data in Excel. It’s designed to answer questions that start with the words, “how many?” or “how much?”.
Getting the basics first
Before you start, review the tutorial written by Matt Waite (data in Excel form here ) of the University of Nebraska to get a basic understanding of summarizing data using pivot tables. There is a video in the middle of that tutorial that walks through the process.
Files for this tutorial:
Arizona Diamondback scores for 2018
Arizona Diamondback stats for 2019 . Consider using this one instead and try to follow along with your own version.
This file has four pages:
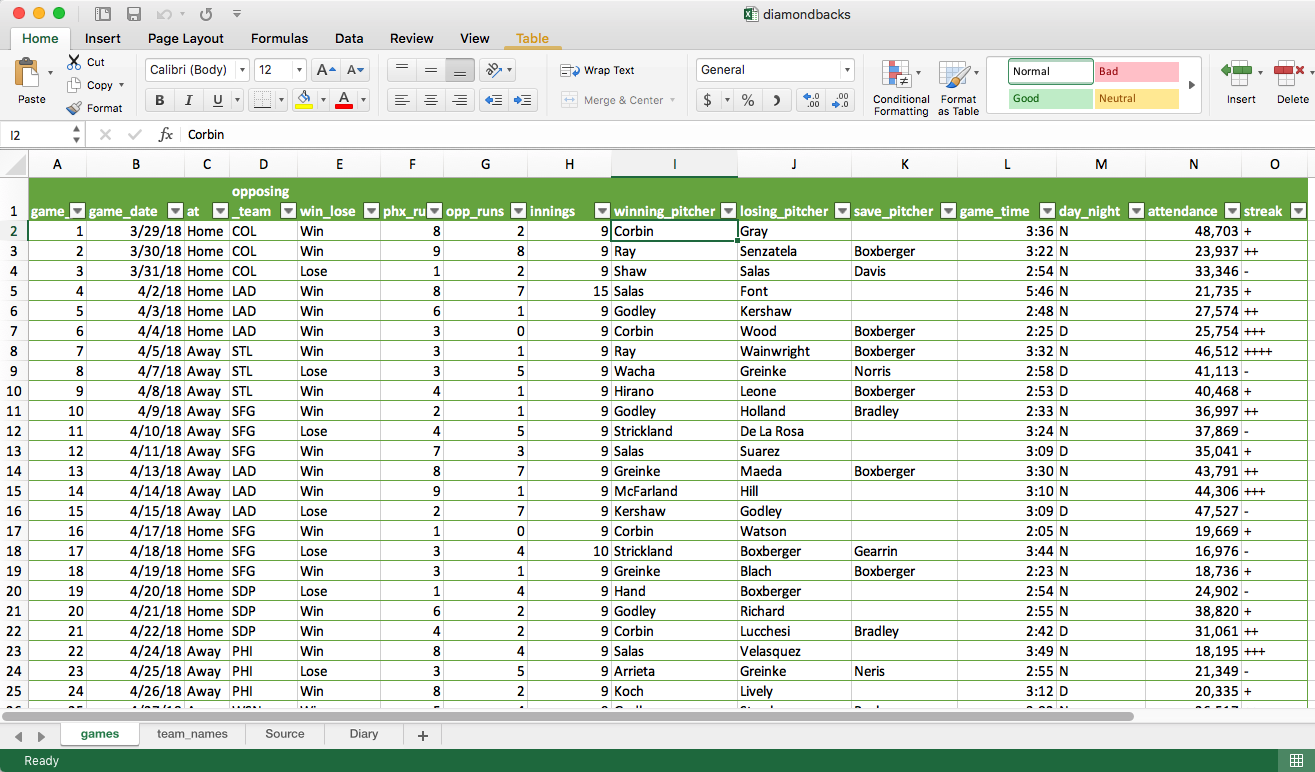
- games: The main data page showing the results the Arizona Diamondbacks’ 2018 season, including the win-loss record, scores, attendance and other details. This data is formatted as a data table, and follows tidy data principles.
- team_names: A translation of the abbreviated team names, to be used in a different exercise.
- source: The source of the data with a glossary of terms
- diary: Changes made to the original to prepare for this exercise
Counting baseball games
Suppose you want to know how many games the Diamondbacks won, and how many they lost in the 2018 season. You could filter the original table, note the number of items shown, and then filter the opposite way. But then you’d have to repeat that every time you wanted to check your answers. Instead, it would be much better if we just had this table:
| Win | 80 |
| Lose | 82 |
| Total | 162 |
That’s exactly what a pivot table does.
Summarize your data
There are several ways to get a new pivot table:
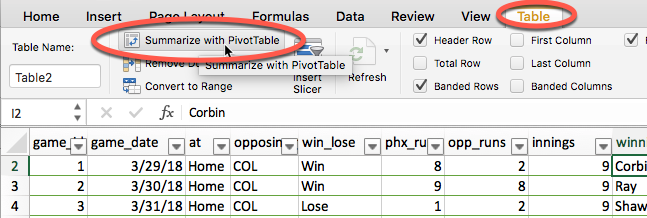
- If your data is formatted as a table, as the Diamondbacks worksheet is, you can select the “Summarize with a Pivot Table” button under the Table tab.
- Select any single cell in your table, and choose Insert, then Pivot Table.
- Use the menu (not the ribbon), under Data, Summarize with Pivot Table. ßß
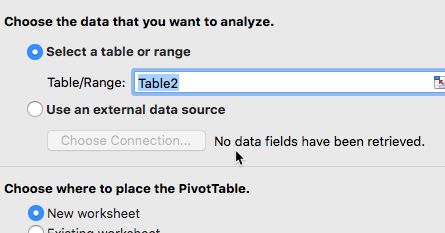
Excel will guess what data you want to summarize – check to make sure it’s right (in our case, Table 2), and then select where to put the table. You’ll usually leave it on the default, which is to make a new page in your workbook.
Now you can pour your data into the empty shell.
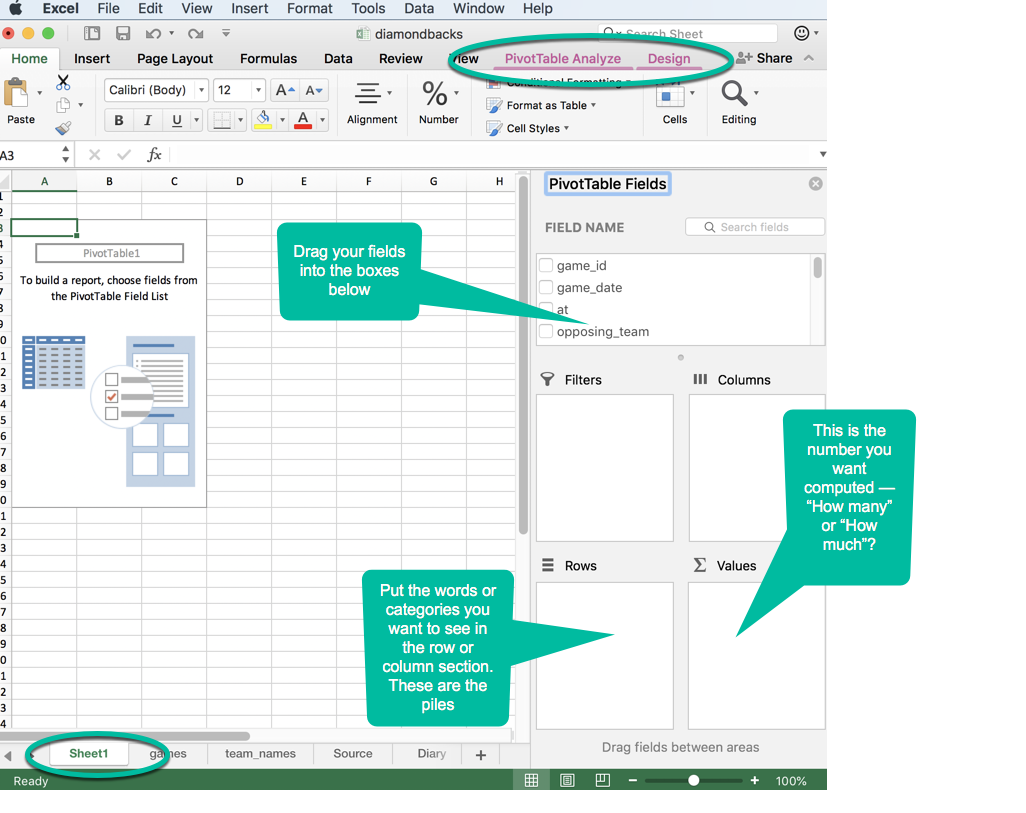
Drag the fields you want from the list into the empty boxes. Anything you put in the “Rows” section will be shown in rows, down the left side of the table. These will usually be categories, names or dates.
The most confusing part of this box is the “Values” area. This is the number that will be shown in the middle of the table – the one you want to compute. If you choose a field that contains words, Excel will guess that you want to count (Count) them up, answering the question, “How many?”. If you choose a field that contains numbers, it will assume you want to add them up (Sum), answering the question, “How much?”.
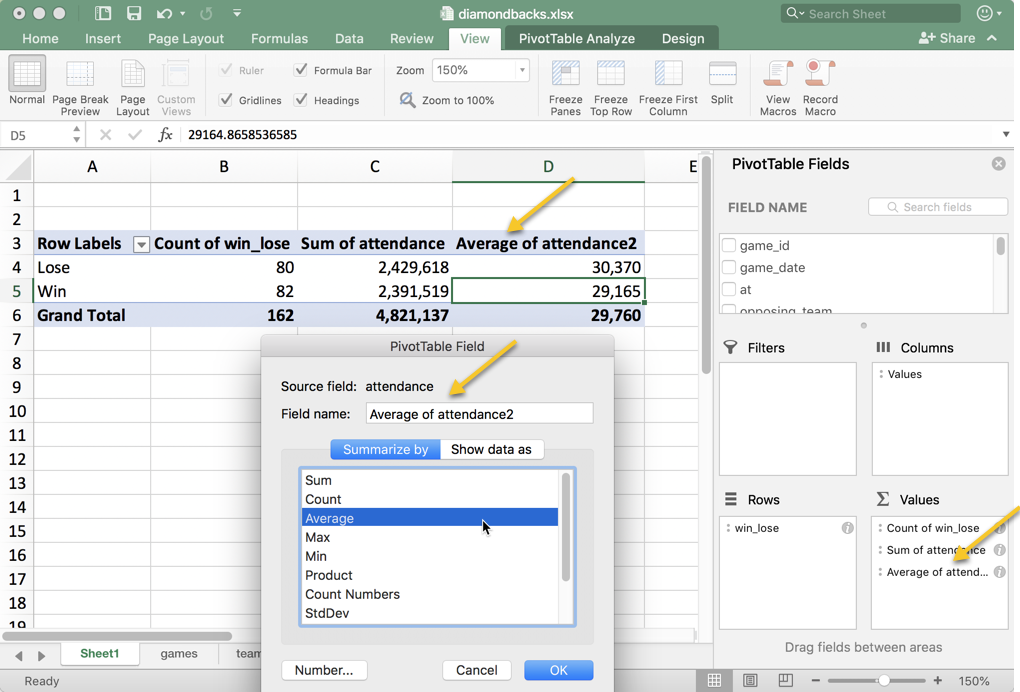
Different kinds of summaries
You can compute more than one number. For example, this table shows you that almost 5 million tickets were sold over the season, averaging 29,760 per game. And that they averaged higher attendance when they lost than when they won.
Automatic percentages
Automatic percentages are computed using the same box, but in a slightly different form. Drag the number field into the Values area again, but this time click on “Show Data As…”, and, in this case, choose “Percent of Column Total”:
More complicated pivot tables
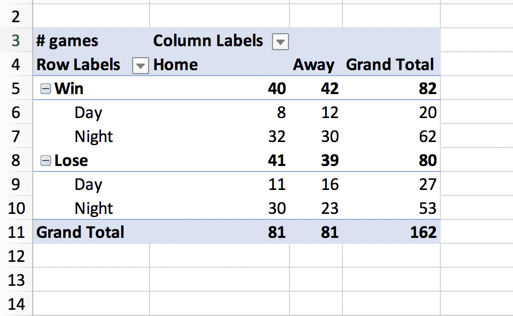
You aren’t stuck with using only one field – you can have as many as you can fit on the page. Here’s an example, showing win-loss statistics at home and on the road, at night and during the day.
Crosstabs
You probably ran into crosstabs when you studied statistics, or in a political science course if you analyzed poll results. The idea of a crosstab is to compare two (or more) variables in two dimensions: columns and rows.
At the simplest level, it’s just a count of how many items fall into each category. In this case, let’s look at how many wins and losses the team had playing at home and away.
Just drag at field into the Column box to get a 2-dimensional table, grouped by both home/away and win/lose.
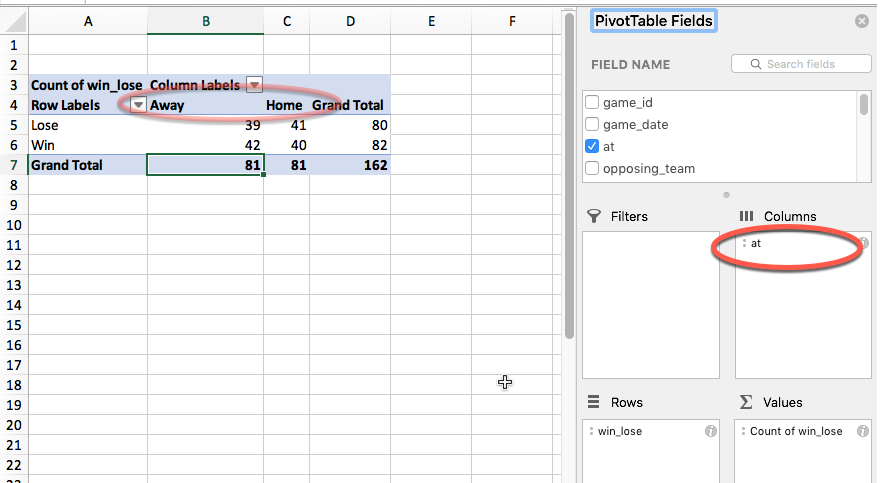
Baseball records make for an easy example because there will always be an equal number of home and away games – there are 81 games in both categories.
It happens that the Diamondbacks won just over half of the games they played. These numbers look like the team does a little better on the road, but it’s hard to know exactly how much better based on raw numbers.
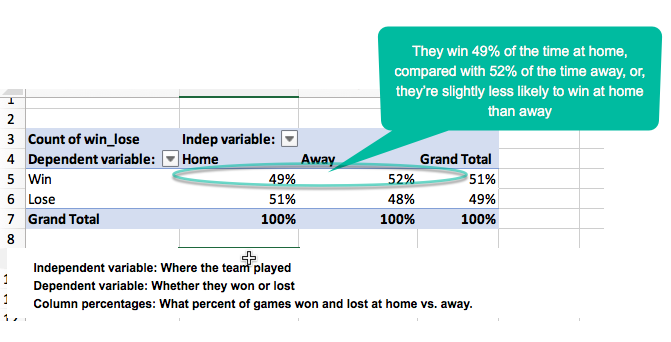
That’s where percentages - or rates - come into play. We’d like to be able to say whether the team is more or less likely to win at home or on the road, and by how much.
These are common kinds of questions in journalism and in life. For example:
- Do immigrants get deported at higher rates when they have criminal histories?
- Are women more likely to get c-sections when they have private health insurance?
- Are high-income minorities rejected for loans at a higher rate than non-minorities?
- Are you more likely to score well on an exam in the morning or afternoon?
Translating these questions into pivot tables takes practice and you often have to read your results out loud to yourself.
At first, just use Philip Meyer’s rule of thumb:
Here’s how it works:
Here’s how it looks when you’re done:
On your own
Try to think of other statistics or comparisons you’d like to calculate by group in this dataset. For example:
- Do the Diamondbacks play better at night or during the day?
- What is the longest game, in innings, played against each team?
- What is the win-loss record against each team?