Data and documentation
I downloaded the data from the FBI for 2016. The files are:
-
Original FBI data. Read the “Data Declaration” at the top of this page. The original data was downloaded from the “Download Excel” link at the top of the page.
-
A cleaned-up version of the dataset for us to use while you’re reading about the UCR. (NOTE: I’ve changed this since class by eliminating the violent crime rate calculation. )
It contains three pages :
- Original_data: This was the full list of cities that the FBI reported. Be sure to review the footnotes at the bottom, which will explain some anomalies you find later on. You should note that it contains three types of numbers:
- A population for the city.
- Total numbers of violent and property crimes, which should be the sum of the parts, except for Arson.
- Each “Part I” type of crime. These are the specific crimes that local police agencies are asked to report to the FBI each year for this program.
-
A somewhat (but not entirely) tidy version of the data, but only for large cities.
- A list of Arizona cities.
Stories that were based on UCR crime data
It’s always worth the time to read how others have presented a common dataset so you don’t miss important nuances.
- “Reports of Rapes and Hate Crimes Rise in 2018, but New York Remains Safest Big City,” New York Times, Dec. 31, 2018;
- “As the number of Reported Rapes Climb, Mayor Points to #MeToo”, New York Times, Jan 6, 2019
- “LAPD misclassified nearly 1,200 violent crimes as minor offenses”, Los Angeles Times, Aug. 9, 2014
- “FBI crime report shows national decline, but uptick in metro-Phoenix” Arizona Republic, Oct. 1, 2018
Check the government’s math
Get in the habit of trying to reproduce numbers that were calculated by others. In this case, you’ll want to check to see if you get the same number of violent and property crimes, based on the FBI’s definitions in the data declaration.
- Calculate the number of violent crimes.
- Calculate the number of property crimes, excluding Arson.
You’ll notice that not all of the numbers match. Returning to the original sheet and looking for footnotes will help explain it.
Understanding rates
A rate is like a percentage, except it usually uses a base other than 100. They’re used to level the playing field when you need to compare dissimilar places or events. Examples include crime rates in cities with different populations or deaths from various diseases across ethnic groups, or Gross Domestic Product across countries.
They’re also used with very big or very small numbers to convert them into something we can understand.
Crime rates are usually expressed as the number of crimes per 100,000 people. That’s because crime is relatively rare – most people are not victims of serious crimes in a given year.
Calculating a crime rate is similar to calculating a per person rate.
If a percent of total (say, of a city budget) is:
each category / total of all categories * 100
You might prefer a per person, or per capita value, such as average income per capita or cars per family.
the number of things / the number of units that could have those things
And a rate per 100,000 people is:
the number of things / the number of people * 100,000
Just be aware that very small groups – small cities or countries, for example – will generate very odd rates. In our example of per 100,000 people, we’d probably avoid comparing rates for cities much smaller than 100,000 population. We could average them over time to generate a more reliable number.
(See pages 12-20 in Numbers in the Newsroom, by Sarah Cohen, available from IRE for more detail.)
FBI Uniform Crime Reports (UCR)
The data you have is only for cities with over 250,000 people in the cleaned-up data.
Getting started
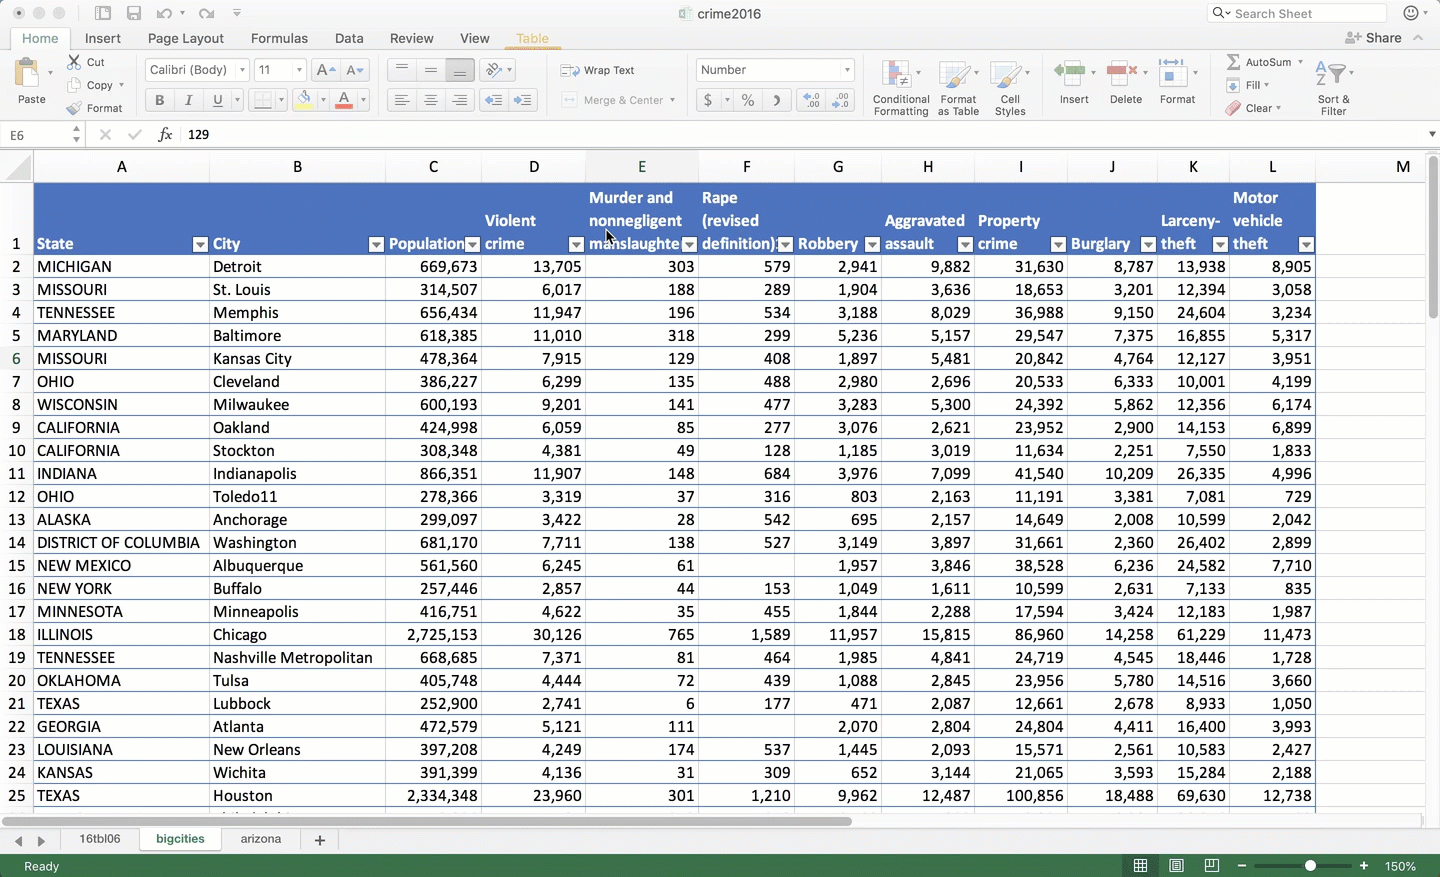
The spreadsheet page called “bigcities” is all cities in the FBI data with at least 250,000 people. That will keep us from relying on results from very small places.
Here are some suggested first steps:
-
Insert a column at the beginning and create an ID field – we want to be able to get back to the sort order that this data came in.
-
Create a data table from the database. Remember to select it by using the keystrokes CTL-SHFT-8 (or CTL-*). (If you do this, I suggest turning off the option to use table names in formulas. It’s under Excel / Preferences / Tables and filters . I narrowed some of the columns and used the Wrap Text button to make the headings taller.
Calculate some rates
Insert a column to the right of Violent Crime and create a Violent Crime Rate column. (A column will always insert to the LEFT of whatever area you have selected.)
Note that the stick-pin (the $ in the formula) is before the “D” – the column element. That means that as you copy down, the row will adjust. But when you copy left to right, the column won’t. It will always use the population column as the base.
Now that you know how to calculate the rate, consider trying some others, such as the murder rate, the rape (sexual assault) rate, and the property crime rate.
Sort and filter
Using your knowledge of sorting and filtering, try asking some questions of your data. For example:
- Which cities (and how many) have a murder rate higher than Phoenix?
- Are there cities with relatively high property crime rates, but low violent crime rates, or the other way around? Think about what that might suggest: either they are doing a good job preventing one, or are perhaps under-reporting the other.
- Do very big cities have higher or lower crime rates than mid-sized cities?
Try thinking of other questions you might ask.
Write a lede
Try picking out one of your findings, and write a short lede paragraph or nut graf that would create the spine of a story, if your findings held up after reporting.