5 Finding the right data for your story
5.1 An example: News21 “Hate in America”
In 2018, News 21 – the multi-university investigative reporting fellowship hosted by ASU’s Cronkite School of Journalism – chose “Hate in America” as its topic for the year. It was a risk because others had been reporting on the subject for more than a year, making it more difficult for News 21 to break new ground. It was also difficult because it became clear quite quickly that no one had documented every case of hate crimes or hate-driven incidents in the U.S.
Data News 21 used
That meant that the team had to find some creative way to quantify the problem. Some of the sources they used included:
Raw data from the National Crime Victimization Survey, an annual survey of crime victims that asks whether hate was an element of the crime. Reporters Catherine Devine and Allie Bice could have used data from a report produced by the Justice Department, but instead analyzed the raw data in a new way to show that about twice as many incidents may have been motivated by hate than previously acknowledged. That analysis was thoroughly vetted by experts in the survey, in hate crimes, and in criminology. It also created a structure around the entire package and provided a newsy lead to the overview story
A database created by a team of reporters who monitored two weeks’ of social media activity from users associated with white nationalists, new-Nazis and other far-right groups on sites including Twitter, Facebook, Gab and VK. It enabled Kia Gardener to write:
News 21 monitored the daily social media activity of various far-right users, including white nationalists and neo-Nazis, from June 10 to June 24. Those tracked had more than 3 million followers combined. Reporters recorded and compiled more than 2,500 posts on popular platforms, such as Twitter and Facebook, and emerging social media platforms, including Gab and VK.
About half the posts were directed at specific demographics or communities, from black Americans and Latinos to Jewish people and LGBTQ members….
– Social Media: Where voices of hate find a place to preach, News 21, August 2018
Federal prosecutions of hate crimes under the various federal statutes. Reporter Lenny Martinez scraped all of the Justice Department’s hate crime-related press releases to find cases the government bragged about. Those cases were supplemented by a list of cases extracted from Westlaw federal case database. The team logged each case in a Google sheet to show what kinds of incidents were pursued by federal prosecutors, and where.
ProPublica’s “Documenting Hate” project, which, with the Southern Poverty Law Center, tried to compile as many stories as they could about hate incidents. ProPublica’s database was a tip sheet, not a quantification. But it served one key goal of any data source: a source reporters could consult when seeking specific types of examples in specific locations.
The FBI Uniform Crime Report’s Hate Crime series. They quickly learned that the data is seriously flawed because of non-response from local police departments and a squishy definition of what should be included. Another flaw was that others, including ProPublica, had thoroughly reported on those flaws and the trends in the data, meaning it failed the test of newsworthiness.
Data the team didn’t use
There were also sources that the team considered but didn’t pursue, sometimes because of the difficulty and sometimes because they were less useful to the project than expected:
The Justice Department’s U.S. attorney case management system, which provided details on cases that the government chose not to pursue along with those they did. (A subsequent analysis showed that the vast majority of these cases were rejected by prosecutors, but vetting the analysis proved too difficult in the time available.)
Databases of graffiti maintained by local police departments. This would have required public records requests to each department for records that usually aren’t clearly public. The team also contacted Google and other companies that publish street level images to see if it would be possible to isolate the hate symbols. Companies declined release images that their users had flagged as offensive.
Historical questions from the Roper Center for Public Opinion Research and the General Social Survey that might have shed light on attitudes about race and religion over time. These proved to be difficult to match up over the years and didn’t really provide much insight.
These are just some of the ways the News 21 team looked far and wide for any sources that could be methodically used to document their stories. As with any project of this type, the search often failed but along the way the whole team learned more and more about the topic and got to know experts in a way they wouldn’t have if they were just seeking quotes.
5.2 Finding data and documents
A big part of data reporting is finding, creating or acquiring records you can use electronically.
Some sources of readily available data could include:
- Government agencies and open government sites.
- Hobbyists and interest groups.
- Data aggregators and data collectors
- Academic researchers who might share their data
- Microdata from surveys and some government programs, such as the Census, Medicare, the General Social Survey and several other standard sites.
- Social data through API’s from Spotify, Twitter and other services.
- Details scraped from online data sources that aren’t available in bulk.
There are also more difficult ways to find data:
- Public records requests
- Whistleblower leaks
- Home made databases created from documents, and free text or image document collections.
- Responses to a survey that you conduct yourself.
- Your own testing on issues such as water quality or soil contamination.
When you start on a project, you’ll usually rely on experts and advocates to lead you to a lot of the possible data sources. But you can also use these strategies to troll for interesting datasets that might make for good stories or practice.
Listen to any caveats and warnings. You may decide that they’re not important, but you don’t want to be blindsided by them in the end. And be sure to ask what they would do if they were you – often, people who have expertise in data have story or project ideas that they can’t get funded or approved, and would be happy for someone else to do them.
When you search using Google, try to use the advanced commands to more precisely hit your target. This tipsheet goes through all of the Google advanced search operators. It changes a lot.
Government agency sites
Try to guess what government agencies – state, local and federal – have an interest in your topic. Browse through their websites to find “Publications” or “Data and research”, or any searchable database. You’ll often find downloadable data there. Once you learn more, you can also evaluate how hard it will be to scrape the data you want. Don’t limit yourself to the jurisdications you care about. If one city or state has a good dataset, there is a strong chance that your local government will have the same thing.
Most agencies and local governments have sites they consider “open government” sites – these are least common denominators of data that they WANT the public to have. But they’re often good starting points. Phoenix, for example, has basic information about police operations in its open site. Simply Googling the agency or jurisdiction name with “open data” will usually find these.
In addition, look for map data from agencies. These often send you to a company called ESRI, which produces interactive maps for government. If it’s on the ESRI site, you can request the underlying data.
Look at federal agency sites to find a least common denominator database – they are usually compiled from more detailed state or local reports.
Even if you can’t find the database, you might be able to find the name of a datset that is maintained internally in audits, footnotes of reports, or IT initiatives.
Once you know a good agency to search, use advanced Google searches for filetype:csv or filetype:xlsx, and limit the site to an agency or city site to bring up datasets that they are letting users download.
News reports
One of the most useful sources to find the names of databases and their original sources is news reports that relied on the data, or refers to a data source quoted by experts. It doesn’t matter if you’re looking at your own area or others – most places have the same kinds of information collected and stories are similar across geographic areas.
You should get good at using all of the resources as precisely as you can. That means getting very familiar with advanced searching in Google, and using LexisNexis and other news databases provided by the ASU library. These offer much more targeted searching than the usual Google search, and will result in much more on-point stories. When you find a good story, consider logging it in a spreadsheet or in doc, and identify:
- Who wrote it and when
- What government sources of data are explicitly mentioned.
- What analysis of that data was done by the news outlet, or what research it depended on.
- Any terms of art that seem to be used around your topic. For example, hate crimes are more frequently referred to as “bias” crimes in many articles – searching for “hate” might not surface them.
IRE.org tipsheets
Another source for information on news stories that used data reporting is IRE, which has two ways to search for more details: the ire.org tip sheets and story archive. Log into IRE.org and choose the tipsheets to look for guides from other reporters; choose the story database to look for stories on your general topic and then click into the form that the reporters filled out that go through their sources. You’ll often find a pair of them – a story, and a tip sheet – that were done by the same person the same year.
(The database library is currently undergoing some review, so a lot of the data listed there could be out of date. But it might also point you to standard sources for data.)
Academic articles
Make sure to do a Google Scholar search for your topic. You will often find one or two researchers who have delved into your subject or a single source. This is often a great shortcut. For example, in the News 21 example, a search of hate crimes in Google Scholar identified an article called “Documenting Hate Crimes in the United States: Some consideration on data sources,” from APA PsycNet. Although this was specifically about sexual orientation and gender diversity, it cataloged the different ways that scholars try to document bias crimes. Once Devine settled on the crime victimization survey, another Google scholar search surfaced an expert on the survey who wrote about how it had changed over the years. He turned out to be the former chief of the Justice Department section that ran the survey, and was one of the project’s best sources. Another source led her to the book, “Statistics for Criminology and Criminal Justice.” One of the authors of that book also provided advice.
Another value of this approach is that it will help you find the technical jargon for the topic you’re studying. It’s often very difficult to do literature searches without knowing that term.
Think tanks / interest groups
Try to find some interest groups that care a lot about your topic on all sides. They often have websites with recent research on your topic and might have experts you can consult. Take their advice cautiously because they often have a point to prove and are unabashed about twisting data to make their point. However, you can often use their raw data to draw your own conclusions. Some news organizations frown on this, so be sure to be transparent about who they are and what they’ve done.
Another good way to use interest groups and think tanks is to get initial versions of public records from them while you wait for your own requests to be processed. At The Washington Post, we used an old version of a weapons trace database for a year while we fought the government for our own; we also used a copy of Agriculture subsidies acquired by the Environmental Working Group while we were waiting for our own public records requests to be completed.
Sometimes, gathering the Tweets from advocates can provide a rich dataset, and it’s relatively easy to do. For example, I once used the Twitter posts from the Police Misconduct project out of the Cato Institute to get a list of all of the stories they’d compiled on the topic.
Data collectors and hobbyists.
Several sites are trying to make businesses out of collected and maintaining databases. Others make available data that they have collected in the past. Two common examples of these are <kaggle.com> and the R “tidy Tuesdsay” competition. These are often old data and have not been authenticated or checked. They exist for data scientists to practice their techniques. But they can give you good ideas.
Be sure to look at the original source for any data you find there. You wouldn’t say a news article came from Google News or Lexis, and you wouldn’t say a dataset came from Google Data Search. If it’s not documented at all, you might have to contact the owner for more detail.
Be careful of most of these. They’re often old, undocumented and poorly vetted. But they will give you a sense of what you might be able to get from a more reliable source, or give you ideas for your own data collection effort.
*data.world** wants to be the Facebook or Instagram of data. It has both private and public accounts, and users upload data they want to share. This means it’s as varied as the people who are in it.
If your newsroom is an AP member, you might have access to its data.world feed, which contains its curated and documented data that local newsrooms can use for their own stories. Some reporters also use data.world to store their public records. Some government agencies are posting their data directly to data.world. But in other cases, they’re undocumented hobbyists.
Vet these the same way you would Google results.
*Journalists’ sites** You can often find individual journalists or journalism organizations in various sharing sites, including Github (which doesn’t show up in default Google searches), data.world and other versioning. Look through their sites to see what they have collected – it’s there to share. Fivethirtyeight, ProPublica and the Los Angeles Times have particularly active data archives.
*Google data search** is, well, the Google of data. In general, data search has limited sources and is more and more frequently logging datasets that are posted by state and local government sources.
It makes no attempt to curate the search, though, so be cautious when you find something.
One use for the dataset search is to see what other cities and counties have voluntarily released. When you see that, it often means your local or state government might have similar data you can request.
For example, searching for police shootings brings up a dataset released by the Orlando Police Department, which contains far more detail than the same dataset released by Phoenix in 2018:
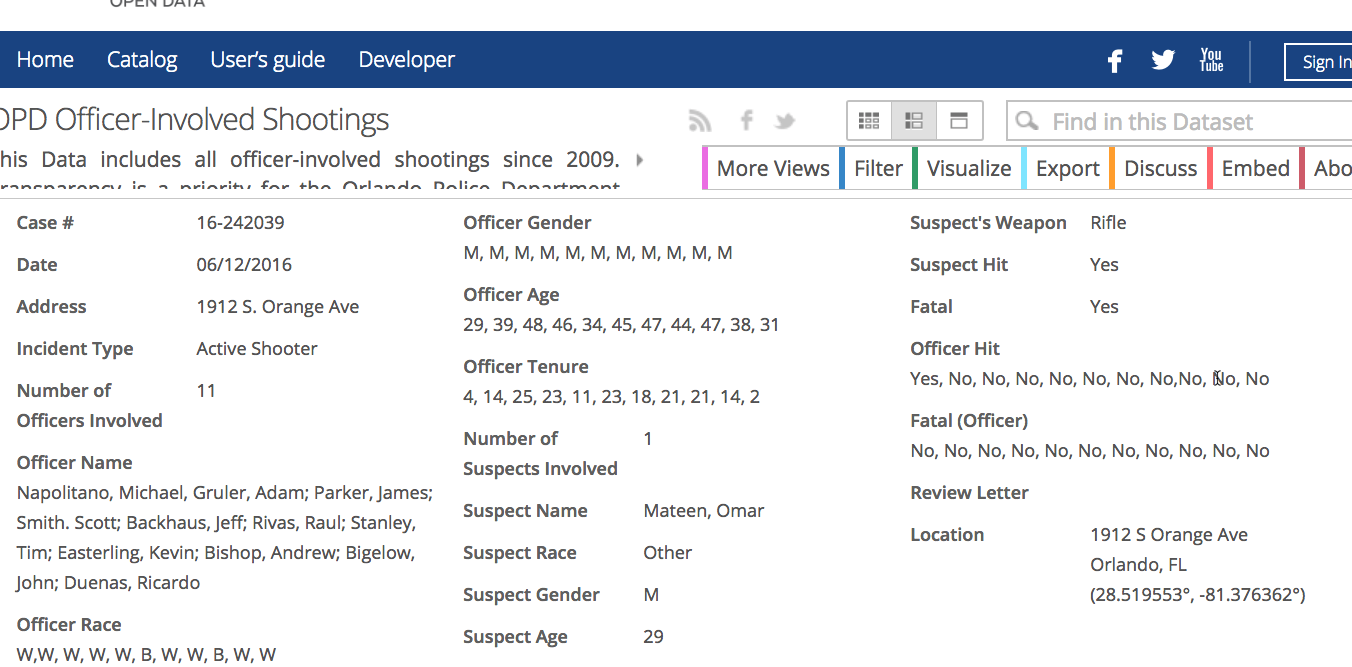
Be sure to look for different terms meaning the same thing. For example, searching “use of force” brings you to completely different sets of data than “police shootings”.
5.3 Vetting data provenance
Before you even open a dataset, you should know how your dataset was collected, who it originally came from and how current it is. A future chapter will go through many of the ways reporters check data they’ve found for completeness, mistakes or other problems.
At first blush, look for anything that precludes using the data because you can’t identify who is responsible for it or how it was collected. This is the same basic vetting you’d do on any source you hope to use.
Look for:
The original source. If you are getting it from a secondary source, look to see how hard it will be to get from original. If it’s from a secondary source, how reliable is it? Are you going to be comfortable crediting them for the data? If you can’t identify where or how the data was collected, you probably can’t use it.
How others have used it and what criticisms were made of that use.
The timeliness of the data. Anything more than two or three years old will be effectively useless for a news article. If it’s old, you should have a plan for how it will be updated.
Data definitions, data dictionaries or record layouts. These are maps to the underlying data, and those definitions can prove difficult to understand.