13 Tidy data principles
Like families, tidy datasets are all alike but every messy dataset is messy in its own way.
– Hadley Wickham, with apologies to the ghost of Leo Tolstoy
You’ve installed the tidyverse without really knowing what it means. That suite of packages is designed to work together around one concept – that of tidy data. It may be the most important data concept you’ll learn this semester.
This chapter may seem abstract, but it will be put into practice very soon.
Tidy data refers to a structure of a dataset that makes it easier to analyze and visualize – it provides a definition of “clean” data. Hadley Wickham, the chief scientist at Posit, developed the concept of tidy data a decade ago. That seminal paper is the glue that holds together all of the packages of the Tidyverse – every one of its 25 or so packages either depends on data structured in this way, or helps you convert messy data into tidy data.1
Read “Spreadsheet thinking vs. database thinking”, by Robert Kosara, a visualization expert at Observable 2 . This piece will get you started thinking about different ways to think about data structures; tidy data is similar to database thinking in this article.
13.1 What is tidy data?
The key characteristics of tidy data are:
- Each column contains one kind of information – race, sex, address, etc. Data scientists call these “fields” or “variables” or “attributes”.
- Each row contains one example of each of those columns, all at the same unit of analysis. In other words, they each refer to the same noun. Data scientists call these “observations” or “cases” or “records”.
- Each value must have its own cell.
Here is how Wickham visualizes these rules:
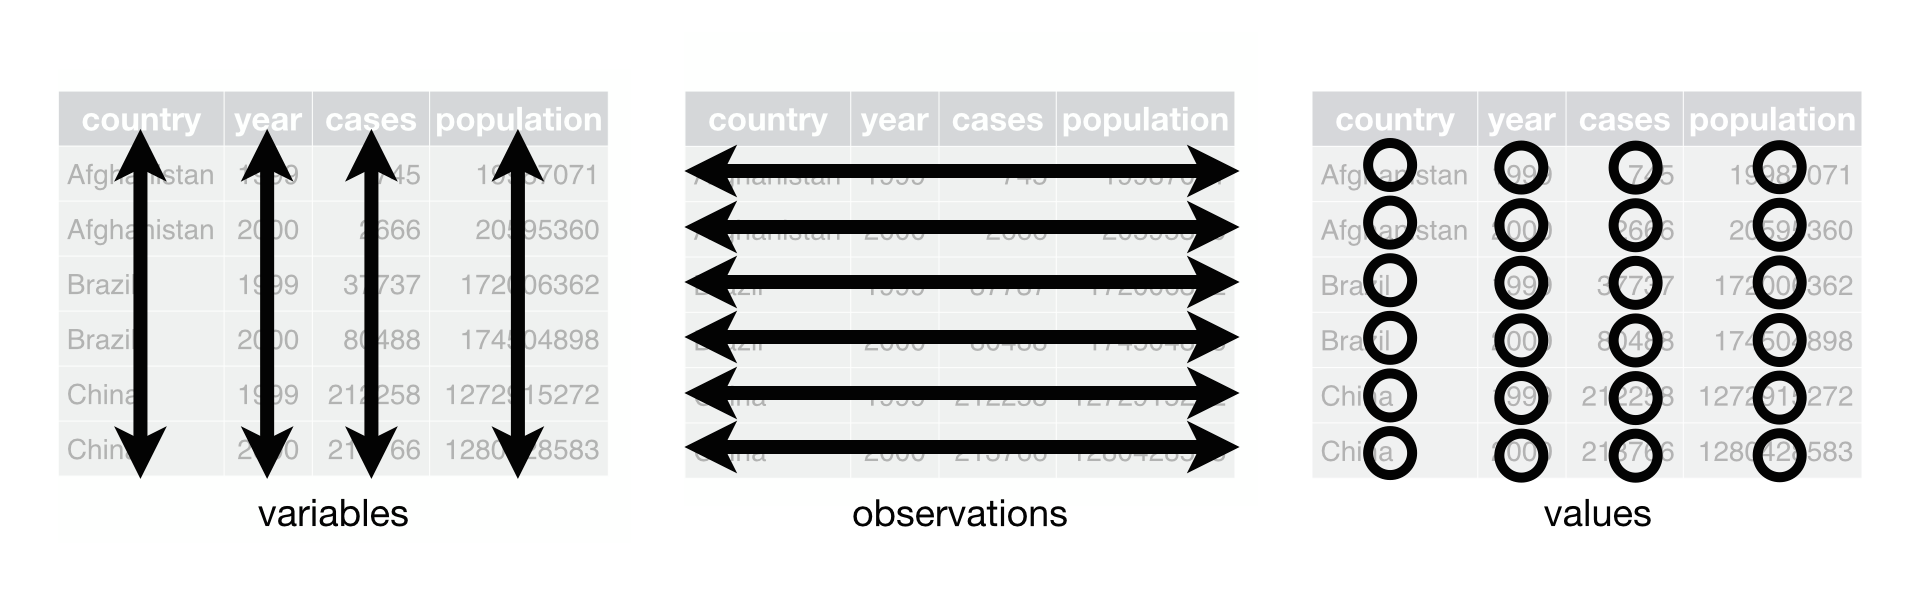
Tidy data tends to have a lot of repeated information in the rows, but has few columns, just like the “database” thinking in Kosara’s piece. Practice looking at any data you find with an eye toward converting it into a tidy structure.
13.2 Understanding data types
When each column holds the same piece of information, it makes sense that each value in that column should be of the same type. Many of the errors or problems in your programs will come from trying to use text when something else is required, or trying to use text when a number is required.
Whenever you get a dataset, you should look for a “data dictionary”, “record layout” or similar document. They tell you what each column is called and what type of data is held in it.
Here are the four most common data types you’ll see in reporting:
Text. Text or “character” columns can come in long or short form. When they are standardized (the values can contain only one of a small list of values), they’re called “categorical”.In reporting, we frequently treat any value that you don’t want to use in a mathematical formula as text. For instance, there is no concept of the sum of Zip Codes. We would treat them as text values to keep them separate from values. Text is the least common denominator of data – all other types can be represented as text, but the reverse isn’t true.
Don’t confuse a text value with the name of a variable or object. For example, the column
zipcodemight contain the value “01243”. The name of the column is unquoted, and the value within it is.Numbers. These are pure numbers with no commas, dollar signs or other embellishments. You can present them as formatted values that are easier to look at, but underneath they’re just numbers.In R, these could be integers (whole numbers), or double-precision values (those that have a lot of numbers after the decimal point, such as geographic coordinates or the results of computations).
There actually aren’t that many pure numbers in the granular datasets that we obtain via FOIA – dollar values and test measurements, for example. In R, as in most programming languages, trying to put text into a column defined as numbers will yield an error or a missing value.
Logical: This is a subset of text. It can take one of only two values – yes or no, true or false. There is no “maybe”.
Date and time: These are actual dates on the calendar, which have magical properties. You see a date or time that makes sense to you, but the computer sees a pure number. A date value in R is the number of days since Jan. 1, 1970; in Excel, it’s the number of days since Jan 1 1900. There are different date and time systems, but the
lubridatepackage in R will handle most of them. The key to date values is that if they are stored as a date, they will sort correctly even though “February” comes before “January” in the alphabet. They also have attributes that you can extract, like the day of the week.
13.3 Real world non-tidy data
Wickham laid out several ways that we see data when it’s not tidy. The three most common are:
Column headings are values, not variables. When a column heading shows each year, it is showing the value of the year variable, not something separate. This happens most of the time when you obtain data that is intended for publication, not analysis.
This is the most common type of untidy data seen in newsrooms, because so many of our datasets come in the form of spreadsheets from sources or the government, or from printed tables in PDF documents that are converted into spreadsheets.
Multiple variables are stored in one column. You have to decide what the important level of detail is: Full name, or first name and last name? More frequently, this is a problem in data that comes from the Census Bureau, which has columns that combine, for example, sex and age. (Male, 25-54 years old)3
Rows might contain different levels of detail. This also comes from getting printouts rather than original datasets, where subtotals and totals are shown in rows, not in a separate table. Again, this is most common in statistical reports intended for printing rather than for analysis.
Separate sheets for the same data. It’s common for government agencies to provide data with one page for each year, or one page for each county. These usually have to be stacked on top of one another.
Your first instinct in creating your own database will likely have one or more of these problems.
Now that you have some of the basic concepts, it’s time to put them into practice!